Financial highlights

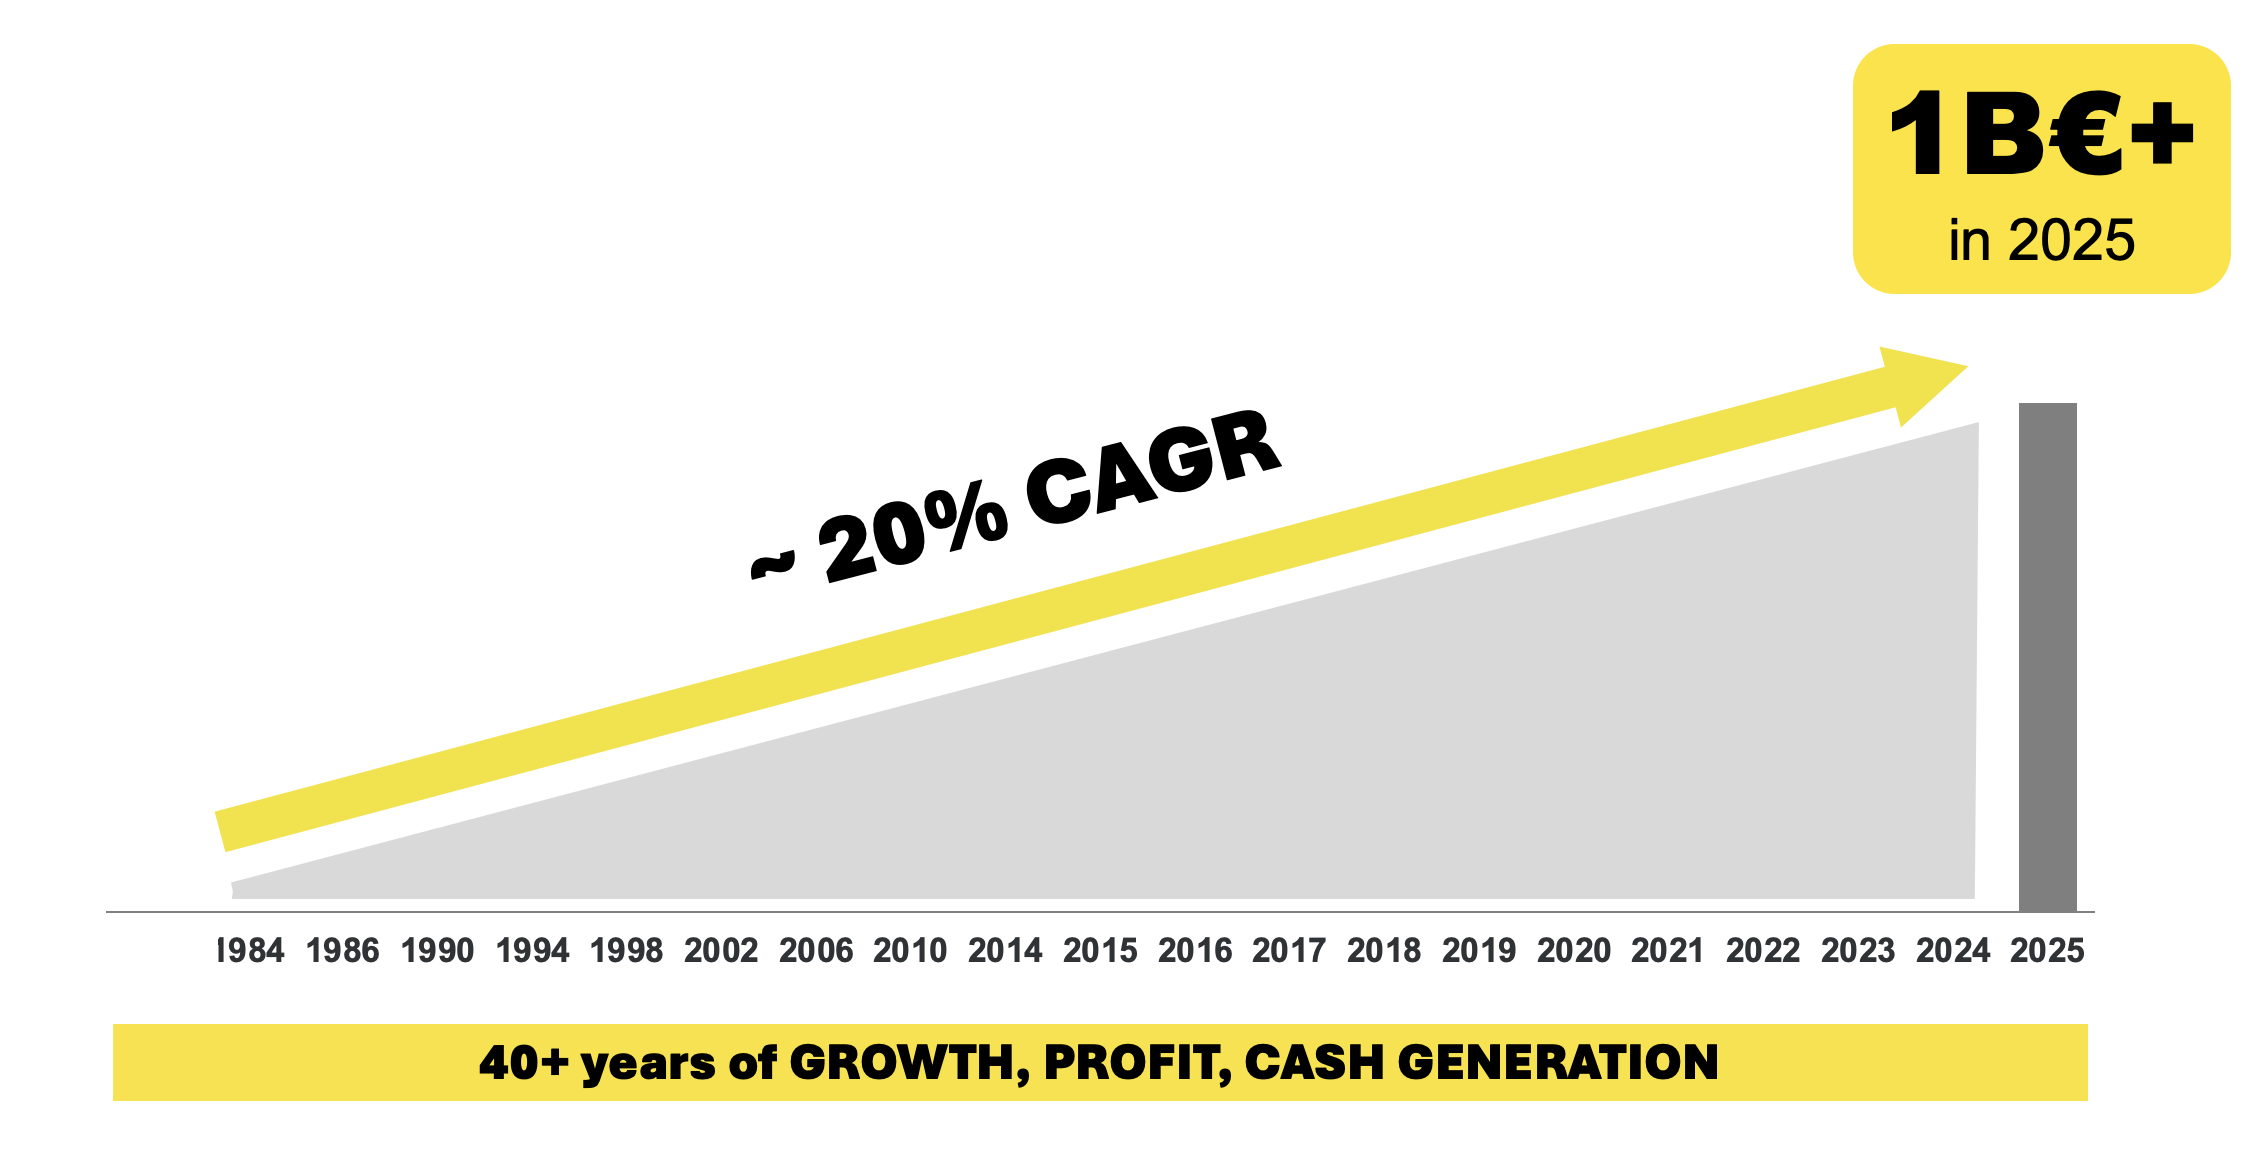
2025 marks a historic milestone for Technogym. Thanks to the passion, expertise, and dedication of our team, we achieved a symbolic result: over €1 billion in revenue, accompanied by strong profit growth. Inspired every day by the sport champions, we view this record not as a finish line, but as a springboard to continue improving and growing.
Nerio Alessandri
Technogym's track record of organic growth
Highlights
| EUR million | |||||||||
|---|---|---|---|---|---|---|---|---|---|
| MAIN METRICS | 2017 | 2018 | 2019 | 2020 | 2021 | 2022 | 2023 | 2024 | 2025 |
| Revenue | 587 | 634 | 669 | 510 | 611 | 721 | 808 | 901 | 1,019 |
| EBITDA adj | 120 | 134 | 148 | 97 | 107 | 132 | 152 | 178 | 220 |
| EBIT | 91 | 107 | 108 | 54 | 79 | 83 | 97 | 122 | 164 |
| Net Profit | 61 | 93 | 83 | 36 | 63 | 64 | 74 | 90 | 120 |
| Tax rate | 28.7% | 13.0% | 21.3% | 24.1% | 20.7% | 23.3% | 23.1% | 27.5% | 27.4% |
| Trade Working Capital | 55.4 | 97.1 | 76.8 | 49.7 | 53.0 | 37.9 | 68 | 65 | 49 |
| Trade Working capital on sales | 79.4% | 15.3% | 11.5% | 9.7% | 8.7% | 5.3% | 8.4% | 7.2% | 4.8% |
| Capex | -24.9 | -32.5 | -36.4 | -23.0 | -27.0 | -34.3 | -35.3 | -39 | -65 |
| Free cash Flow | 61 | 29 | 99 | 79 | 66 | 78 | 71 | 116 | 117 |
| INDEBTEDNESS | |||||||||
| Net Financial Position | -41 | -35 | 4 | 59 | 96 | 122 | 127 | 160.1 | -156.0 |
| REMUNERATION | |||||||||
| Dividend Yeld % | 1.1% | 1.9% | 0.0% | 2.4% | 1.9% | 3.6% | 3.2% | 8.4% | 2.9% |
| Dividend (milion euro) | 18.1 | 36.2 | - | 44.3 | 32.2 | 50.3 | 50.3 | 159.3 | 75.7 |
| Total number of Shares | 201,005 | 201,005 | 201,005 | 201,328 | 201,328 | 201,328 | 201,328 | 201,328 | 201,328 |
| TGYM average share price | 8.1 | 9.6 | 11.6 | 9.3 | 8.5 | 7.3 | 8.1 | 9.4 | 13.0 |
Learn more

Governance reports and documents
Download reports, PDFs and documentation related to corporate governance.

Press releases
Read and download the latest Technogym financial press releases. Subscribe to get the latest financial information to your inbox with our email news alerts.